
Basketball Journal
Why small statistical samples can mislead basketball fans
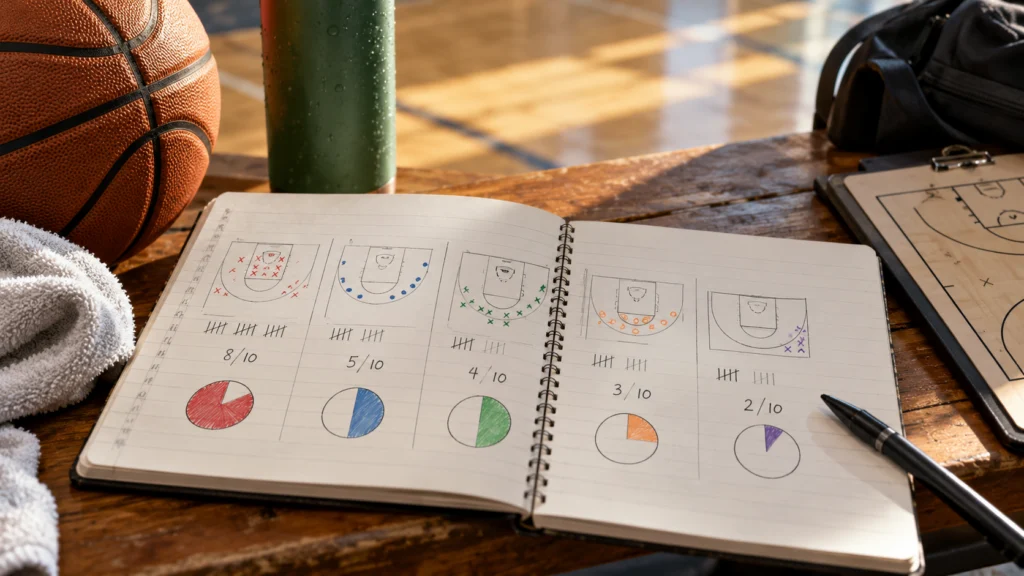
A few games can produce a convincing story before there is much evidence behind it. A hot shooting night or a dramatic lineup result may be real and still be a weak basis for a permanent conclusion. Begin by asking how many opportunities the statistic describes.
Keep the denominator visible
In a fictional five-shot sample, two makes produce 40% and three produce 60%. One different outcome moves the percentage by 20 percentage points. The arithmetic does not identify a player’s stable ability; it shows how sensitive a small sample can be.
Use counts, minutes or possessions alongside the rate. A percentage without its denominator can make a brief observation look as substantial as a full season. Do not compare them without noting the difference.
| Question | Check | Why |
|---|---|---|
| How much evidence? | Attempts, minutes or possessions | Shows sample size |
| Which context? | Opponents, role and availability | Samples may not be comparable |
| Which filter? | Season, game type and dates | Prevents selective comparison |
| What conclusion? | Observation or broad prediction | Keeps confidence proportionate |
Do not ignore a pattern simply because it is early
A short sample can reveal a question worth watching. The mistake is treating it as settled. Describe what happened and identify what additional evidence would strengthen or weaken the explanation.
Video can help distinguish a changed role from a streak of outcomes, but it also has limits. A few selected clips may be a small sample in another form.
- Show the count behind the percentage.
- Use matching filters.
- Separate an early observation from a stable conclusion.
- Revisit the claim as more relevant evidence appears.
Avoid changing the standard after the result
Choose the comparison period for a reason rather than selecting dates that support a favourite player. Keep the earlier claim so later review does not turn into hindsight. A good analysis can be revised without pretending it was always obvious.
The NBA glossary helps define the measure, but a correct definition does not remove sampling uncertainty. Statistical literacy includes both understanding the calculation and knowing what it cannot establish.
Save the original claim with its date, denominator and comparison window. For example, an early note can say that a particular action appeared more often in the games watched, followed by a question about whether it continues. At the next review, use the same definition and explain any added games. No fixed number of games is a universal proof threshold; the purpose is to prevent the question changing every time the result changes.
Questions and answers
Does a small sample mean the result is false?
No. The observed result can be accurate while a broad inference remains uncertain.
Are the five-shot numbers real player data?
No. They are explicitly fictional arithmetic examples.
Can selected highlights create the same problem?
Yes. A few chosen clips may not represent the full pattern.
Sources: nba.com.