Basketball Journal
What shot charts reveal about an offence
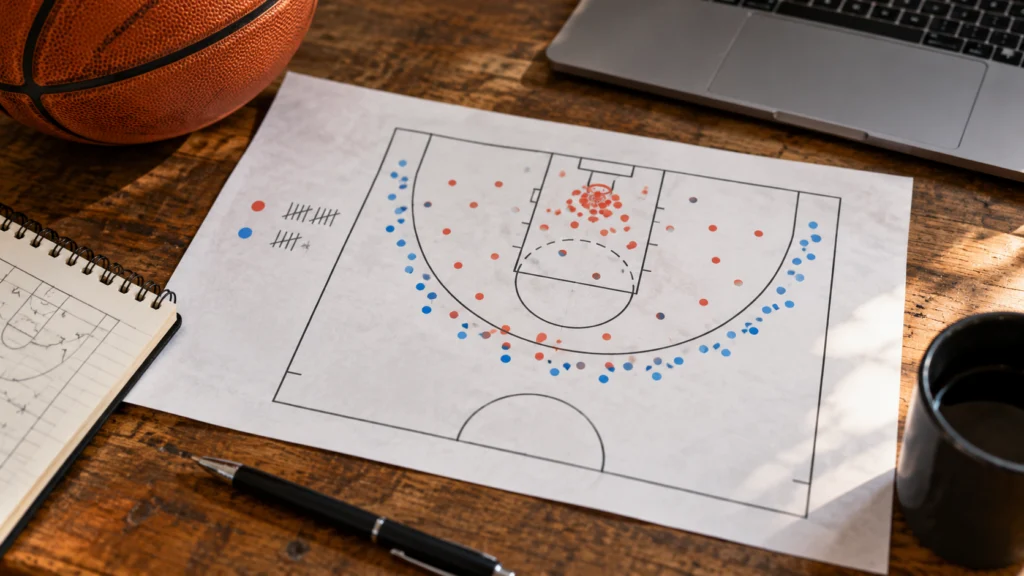
A shot chart shows where attempts occurred and, depending on the display, their outcomes. It is a useful map, not a complete explanation of an offence. The same location can produce a clean opportunity or a heavily pressured late attempt.
Check what the chart displays
Identify the player or team, period and filters. A chart of makes alone is different from one showing every attempt. Compare the same court zones and time range before drawing conclusions.
Look at volume before percentages. A striking colour in a rarely used zone may reflect only a handful of attempts. Keep the count visible so a small sample does not acquire the authority of a season-long pattern.
| Question | Chart evidence | Extra context |
|---|---|---|
| Where are shots taken? | Location and attempt count | How the offence reaches them |
| Which zones are frequent? | Distribution of attempts | Role and lineup spacing |
| What went in? | Makes and percentage | Sample size and variation |
| Was the chance good? | Location is one clue | Defender, clock and possession sequence |
Separate location from decision quality
A close shot can be difficult and an outside shot can be well created. Watch the preceding pass, defender position and time pressure. Do not label every miss from a preferred zone a bad decision.
The NBA glossary distinguishes attempts, makes and percentages. Keep those measures separate when comparing two charts. More attempts in a zone do not automatically mean better accuracy there.
- Use matching filters and periods.
- Keep attempt counts beside percentages.
- Watch possessions behind a notable pattern.
- Avoid a complete verdict from one game’s colours.
Build a testable observation
Instead of saying “the offence is broken”, describe a pattern such as repeated late-clock attempts from a particular area. Then check more possessions and comparable games. The chart can help choose where to look.
If the pattern changes, verify lineup and availability context before inventing a cause. A useful analysis can remain conditional while still explaining what the visual evidence shows. Read the legend too: colour may compare with a league baseline rather than simply show the raw shooting percentage.
For a fictional chart, one zone could show three makes from four attempts and another six from fifteen. The first percentage is higher, but the second zone supplied more made shots and more evidence about the selected period. Neither figure alone reveals defensive pressure. Keep the attempts, makes and video question together instead of letting the brightest colour settle the analysis.
Questions and answers
Does a chart show whether a shot was open?
Not necessarily. Check the display’s data and use video or relevant tracking context.
Can a hot zone be trusted with very few attempts?
Treat it cautiously. A small count can make percentages unstable.
Are makes-only charts enough?
They omit missed attempts and can distort the impression of frequency. Know what the chart includes.
Sources: nba.com.